Burndown Chart in Scrum to Master Agile Progress
As the world of software development continues to rapidly evolve in 21st century, turning chaos into order has become an instrumental part of success. A surefire way of gaining control over your project lifecycle is through a seemingly simple, yet immensely powerful tool - the Burndown Chart. Highly esteemed in Scrum - a leading agile framework for completing complex projects, this graphical representation can revolutionize your approach towards managing tasks and timeframes. This blog post will guide you through how to use the Burndown Chart effectively within the context of Scrum to achieve seamless software development cycles. Step right in and transform your sprint planning into a strategic powerhouse!
A burndown chart is a valuable tool in Scrum for visualizing the progress of work over time. It helps teams monitor project scope, track their schedule, and compare planned work against actual progression. By plotting the remaining work against time, the burndown chart enables teams to forecast when all the work will be completed and make informed decisions to ensure successful sprint deliveries.
Burndown Chart in Scrum Definition: The Scrum Burndown Chart is a visual measurement tool that shows the completed work per day against the projected rate of completion for the current project release. Its purpose is to enable that the project is on the track to deliver the expected solution within the desired schedule.
Understanding Burndown Chart in Scrum
In Scrum, a burndown chart is a visual representation of a team's progress over time towards completing their sprint goal. Created at the beginning of each iteration, burndown charts measure the work remaining to be completed versus time. This allows team members to see the amount of work left and helps them make adjustments to stay on track.
Imagine that you're working on a software development project using Scrum. You have a two-week sprint with 80 hours of work estimated in your Sprint Backlog. After the first day, you've completed 20 hours of work, so you should have 60 hours remaining. The burndown chart shows this baseline as the expected rate of progress for completing all tasks.
As the days progress, if actual progress matches or exceeds these projections, then things are going smoothly. If the team is struggling to keep up or working ahead, then there may be some underlying issues that need to be addressed. That’s why monitoring the burndown chart can help prevent potential difficulties from becoming more challenging problems in the future.
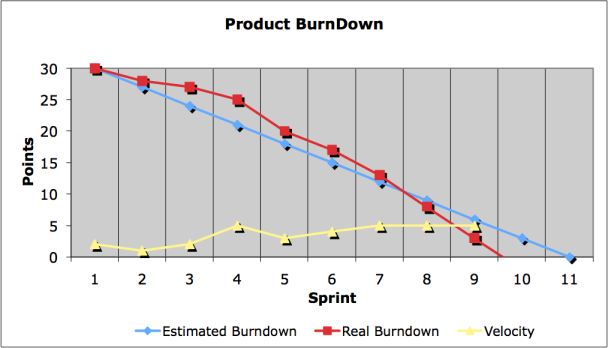 Scrum Burndown Chart (Simple Scrum Burndown Chart)
Visual Representation of Work vs Time
One significant advantage of using a burndown chart is its simplicity and ease of use. It is usually represented graphically on a vertical axis - often showing "work remaining" in story points or hours - juxtaposed against time depicted along the horizontal axis.
Think of it like navigating through Google Maps when driving to an unfamiliar destination - progress marked by navigational milestones, alongside current location and estimated distance to intended destination.
Ideally, the plotted line should follow a projected perfect straight-line trend throughout the iteration period until all goals are met- hence called Ideal Trend Line (ITL). Nonetheless, circumstances vary and usually diverge from ITL; Deviations from it may indicate overestimation, underestimated complexity in tasks assigned or blockers impeding progress.
So how can teams align their burndown chart trajectory more closely with the ITL, and what does a healthy burndown chart look like? These are some of the fundamentals we’ll delve into in our next section.
How to Utilize a Burndown Chart
One of the most significant benefits of working with a burndown chart is its ability to provide up-to-date and accurate details on project progress. With an appropriate chart, you can easily track progress against your project goals, monitor any deviations from the ideal slope, and discover issues hindering timely completion of tasks. To utilize a burndown chart effectively, it needs constant review and updating to ensure all data is current.
For instance, if during a sprint, the team completes tasks at a slower rate than expected due to an unforeseen challenge or unanticipated complexities in development requirements, the burndown chart will show this deviation from the ideal trend line.
Through reviewing the chart regularly and identifying these fluctuations in progress, you can take corrective action with the team proactively. This way, the project doesn't fall off track and adjusts as necessary to stay aligned with goals.
- According to the 14th VersionOne State of Agile Report, 83% of respondents - who primarily represent software teams - reported using Scrum or hybrid Scrum methods, indicating the potential widespread use of burndown charts as one of the key control mechanisms.
- A study published in 'Information and Software Technology' analyzed 160 sprints from 16 software development projects and found that they often diverged from the ideal burndown line with an average skew of approximately 25%.
- The same study indicated that despite this, about 72% of these sprints met their completion goals, suggesting the regular analysis and adaptability enabled via tools like burndown charts can help manage deviations successfully over time.
- The burndown chart is a valuable tool for tracking project progress and identifying issues that may impact timely completion. It allows teams to monitor deviations from the ideal slope and take corrective action proactively. Regular review and updating of the chart are crucial to ensure accurate and up-to-date data.
Steps to Create a Chart in Scrum
To create a useful burndown chart in Scrum requires some pre-planning before teams can start tracking their progress effectively.
Think of it like building a house. Before construction begins, architects must design blueprints that serve as guides for builders. Similarly, before creating a burndown chart, specific parameters must be defined to work towards achieving measurable goals.
Before we dive into specifics on how to create one for software development in Scrum, bear in mind that there are multiple options available for generating charts; online tools like Visual Paradigm's Process Canvas offer intuitive interfaces and automated processes making the task even easier.
However here are general steps:
- Determine Sprint Length: The first step is determining how long your sprints run for – usually between 1-4 weeks.
- Identify Sprint Backlog: A backlog defines what items need attention at any point within development; the same applies when creating a burndown chart; identify all the items required to be delivered during each sprint.
- Determine Velocity: Velocity is defined by the amount of work completed by your team within a specified period. It's essential to establish this metric beforehand, as this becomes a guiding factor when estimating sprints.
- Design Burndown Chart: Using the data above, design a chart that aggregates this information, providing you with an accurate map of progress against goals.
Remember, once created, always update the chart daily to track your team's work progress and regularly review how this data corresponds with your ultimate project objectives.
Now armed with knowledge on how to create a burndown chart in Scrum let’s dive into monitoring progress using it.
Monitoring Progress through Burndown Chart
In the Scrum methodology, teams use a burndown chart to track their progress towards completing all work items within a sprint. This way, team members have an accurate idea of how much work is outstanding and can adjust their approach accordingly. The burndown chart is updated daily with new information regarding tasks completed versus remaining efforts., which means it's monitored frequently and provide insights over time.
The rate of progress of a Scrum Team is called "velocity". It expresses the amount of e.g. story points completed per iteration. An import rule for calculating the velocity is that only stories that are completed at the end of the iteration are counted. Counting partially finished work (e.g. coding only - test missing) is strictly forbidden.
After a few Sprints the velocity of a Scrum Team will most likely be predictable and would allow quite accurate estimation about the time needed until all entries in the Scrum Product Backlog will be completed. If the velocity of a Scrum Team is e.g. 30 story points and the total amount of remaining work is 155, we can predict that we need about 6 Sprint to complete all stories in the Backlog.
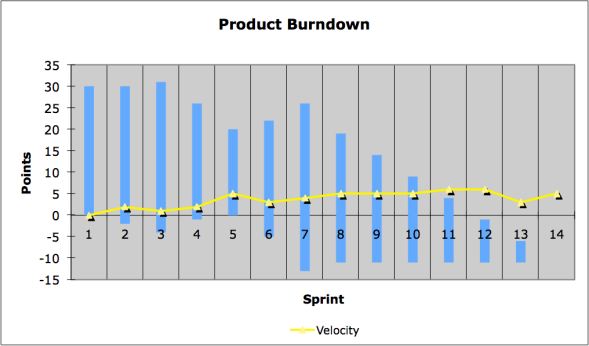 Scrum Burndown Chart - Separating Velocity and Scope Changes
For instance, imagine a two-week sprint where team velocity is determined at 100 story points per week. By plotting in daily progress in the burndown chart, the team can tell whether they are ahead or behind schedule and take corrective action if needed.
With monitoring in place, understanding how to read and interpret the data from the burndown chart is key.
Interpreting the Burndown Chart Data
The burndown charts’ horizontal axis represents time while the vertical axis showcases the amount of work remaining during each day or one that ideally depletes to zero by the end of the sprint. A healthy burndown chart follows what’s called an ideal trend line, which represents completion potential over time.
Let's say you have a Sprint duration of ten working days and 100 hours of total work to complete; then on DAY 1, you should expect your ideal burn down rate to be ten hours per day.
Any deviation from this trend line indicates issues such as scope creep or inaccuracies with estimation. Teams must investigate these deviations promptly to determine whether changes need to be made to meet goals successfully. In particular, if work measurements consistently fall below the ideal burn down line, it indicates that project planning needs improvement. On the other hand, tasks getting completed before due date suggests that estimation was too high, and more work can be done.
Think of it like speed-reading a book, if you can read and comprehend at an average pace of 50 pages in an hour but realize that it's taking you more than 45 minutes to read 20 pages. That deviation indicates something is amiss - either that your pace needs improvement or the book requires extra attention.
Assessing Sprint Goals via the Chart
The burndown chart is a powerful tool for assessing whether sprint goals are achievable or not. It helps teams track progress towards completing all user stories in the sprint backlog. By visualizing remaining work over time, team members have a clear understanding of the amount of effort required daily to meet the set objectives.
In the context of Agile software development, committing to a sprint goal without knowing whether the team can complete it within the iteration could lead to delays, missed milestones, and ultimately project failure.
With a burndown chart, you can quickly identify when goals are likely to be met successfully before the end of the Sprint. Ideally, by reviewing previous sprints' patterns and monitoring each day's progress against this history, teams can proactively course-correct to ensure successful outcomes.
Understanding how to manage these charts is equally essential as they have both benefits and drawbacks in software development.
However in reality the entries in the Scrum Product Backlog will change over the duration of the project. New stories are added and other stories are changed or even deleted. In the simple Burndown Chart the velocity of the Scrum Team and the change in the scope cannot be distinguished. To reflect this, another form of diagram can be used.
Pros and Cons of Burndown Charts in Agile Team Management and Software Development
Burndown charts are one of the most frequently used metrics in Scrum because they are simple yet effective ways to visualize progress and predict completion dates. However, like any other tool, there are both pros and cons associated with their use.
Pros
Burndown charts provide transparency and insight into how much work remains at any given point in time. The simplicity and clarity of its visualization help avoid information overload while providing valuable oversight of daily activities.
Additionally, Burndown charts encourage accountability within teams by revealing who's carrying the most significant workload and who's moving slowly, empowering members to make informed decisions daily to achieve their objectives.
Cons
While burndown charts offer tangible benefits, they also have some potential drawbacks worth considering. For example:
- They might give an unrealistic impression: Depending on estimations made previously on technical complexity or product specifications or other factors that could arise when developing, burndown charts might give the impression of exponential overall progress towards the end of the sprint.
- They may reduce efficiency: In certain cases, burndown charts could lead to over-monitoring by individual team members. It creates interruptions as updates are added to the chart and neglects other productivity aspects.
- They could encourage micromanaging: If not used correctly, burndown charts could become a tool for managers to micro-manage their team. This situation could lead to decreased autonomy, negative morale, and poor decision-making.
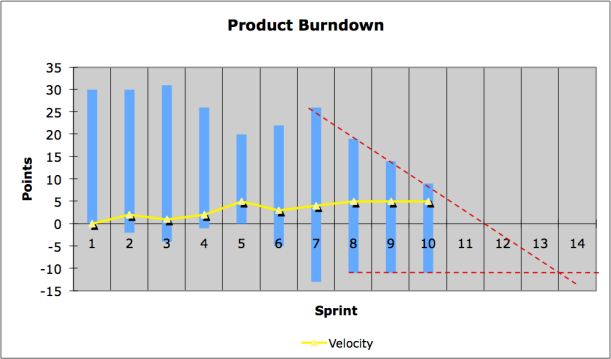 Scrum Burndown Chart: Extended Burndown Chart with Prediction
While the above limitations seem possible but not absolute implications of using burndown charts, it is essential to weigh these risks against the gains made through tracking projects via this metric. The best course would be to discuss them with your team and adjust them according to your specific context.
Here a bar chart instead of a line diagram is used. The size of each bar represents the total amount of work remaining at the start of each sprint. The velocity of the team is subtracted from the top while changes in the Scope change the bottom of the bar.
To get even more accurate we can also take the rate of changes in total work into account. However we have to be careful when using this model since the rate of change will be high in the beginning of the project but will drop at the end.
How frequently should a burndown chart be updated in a Scrum project?
A burndown chart in a Scrum project should be updated daily. By updating it daily, the team can track their progress and identify any issues or roadblocks in real-time. This allows for faster decision-making and enables the team to take corrective actions if needed, ensuring that the project stays on track. Additionally, daily updates provide valuable data that can be used to analyze team performance and forecast project completion dates accurately.
How does a burndown chart help in managing Scrum projects?
A burndown chart helps in managing Scrum projects by providing a visual representation of the progress of work throughout a sprint. It tracks the remaining work versus time, allowing the team to see if they are on track to meet their goals. This chart helps in identifying any issues or bottlenecks that may arise during the project and enables the team to take necessary actions to stay on schedule. Statistics from previous sprints can be used to forecast future progress and make informed decisions.
What information does a burndown chart convey about project progress?
A burndown chart conveys valuable information about the progress of a project in Scrum for software development. It shows the amount of work remaining versus time, providing a visual representation of whether the team is on track to complete the project within the allotted time. The slope of the burndown line indicates the velocity at which work is being completed, and any deviations from expected progress can be identified and addressed promptly. Additionally, the chart helps stakeholders and team members identify trends, make informed decisions, and adjust their strategies if necessary.
Are there any specific tools or software used to create burndown charts in Scrum?
Yes, there are specific tools and software available to create burndown charts in Scrum for software development. Popular project management tools like Jira, Trello, and Microsoft Azure DevOps offer built-in functionality to generate burndown charts. These tools provide a visual representation of the work remaining over time, allowing teams to track progress and identify any deviations from the plan. Statistics show that utilizing such tools improves team collaboration, facilitates transparency, and helps in making data-driven decisions for successful project delivery.
Are there any best practices or tips for interpreting and using the data from a burndown chart effectively in Scrum?
Yes, there are several best practices for interpreting and using the data from a burndown chart effectively in Scrum. Firstly, it is important to update the chart daily to ensure accurate tracking of progress. Additionally, teams should aim for a steady and consistent slope, indicating a predictable and sustainable pace of work. If the chart shows a steep drop or an increase in scope, it highlights potential issues that need immediate attention. Furthermore, comparing the actual versus planned burndown helps identify areas of improvement and adjustments in future sprints. Studies have shown that teams who effectively utilize burndown charts achieve higher productivity and better predictability in delivering software projects (Source: Agile Alliance).
Recap for Burndown Chart in Scrum
In reviewing the essence of the "Scrum Burndown Chart", it becomes evident that this powerful tool encapsulates various key elements integral to agile project management. Furthermore, the sprint burndown chart, a graph illustrating the work line against time during a given Sprint, plays a pivotal role in tracking the progress of Sprint Goals.
An estimate, in the form of work estimates and issue estimates, contribute to shaping the Scrum burndown chart. The number of units estimated for completion forms the basis of this visual representation, creating a dynamic snapshot of work progression. A project manager, scrum masters, and product owners are key players in utilizing this tool to keep a keen eye on the project's status and mitigate potential risks.
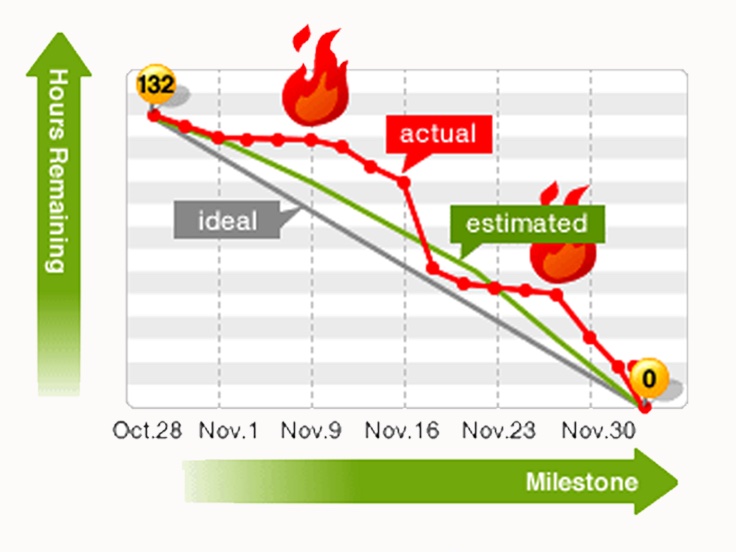 Scrum Burndown Chart
The scrum master, acting as a facilitator, ensures that the Scrum burndown chart serves its purpose in an agile sprint. Meanwhile, the product owner, representing the business and customers, monitors the chart to align the project with the overarching goals of the company. The Scrum burndown chart becomes a template for transparency, enabling efficient communication and collaboration among team members.
For companies employing agile methodologies, the burndown chart becomes an invaluable page in their project management documents. It accommodates epics and timelines, offering a comprehensive overview of the project's trajectory. This visual representation not only aids in tracking work progress but also highlights the difference between estimated and actual completion, fostering continuous improvement.
Integrated seamlessly with project management tools such as Jira and Trello, the burndown chart aligns with the workflow, streamlining the tracking process. It becomes a dynamic instrument, reflecting the sum of efforts and aligning with the evolving nature of the project.
In conclusion, the Scrum burndown chart scrum stands as a beacon of efficiency, providing a visual representation of work progress, estimates, and potential risks. It serves as a template for collaboration and transparency, supporting businesses and products in their agile endeavors. Whether a project involves articles, business products, or company initiatives, the burndown chart remains an indispensable asset, guiding teams towards successful project completion.
Share It With Your Colleagues and Friends to Help Them Learn:
Burndown Chart in Scrum to Master Agile Progress
|
|

|

|

|

|
|
 SCRUM INSTITUTE™


